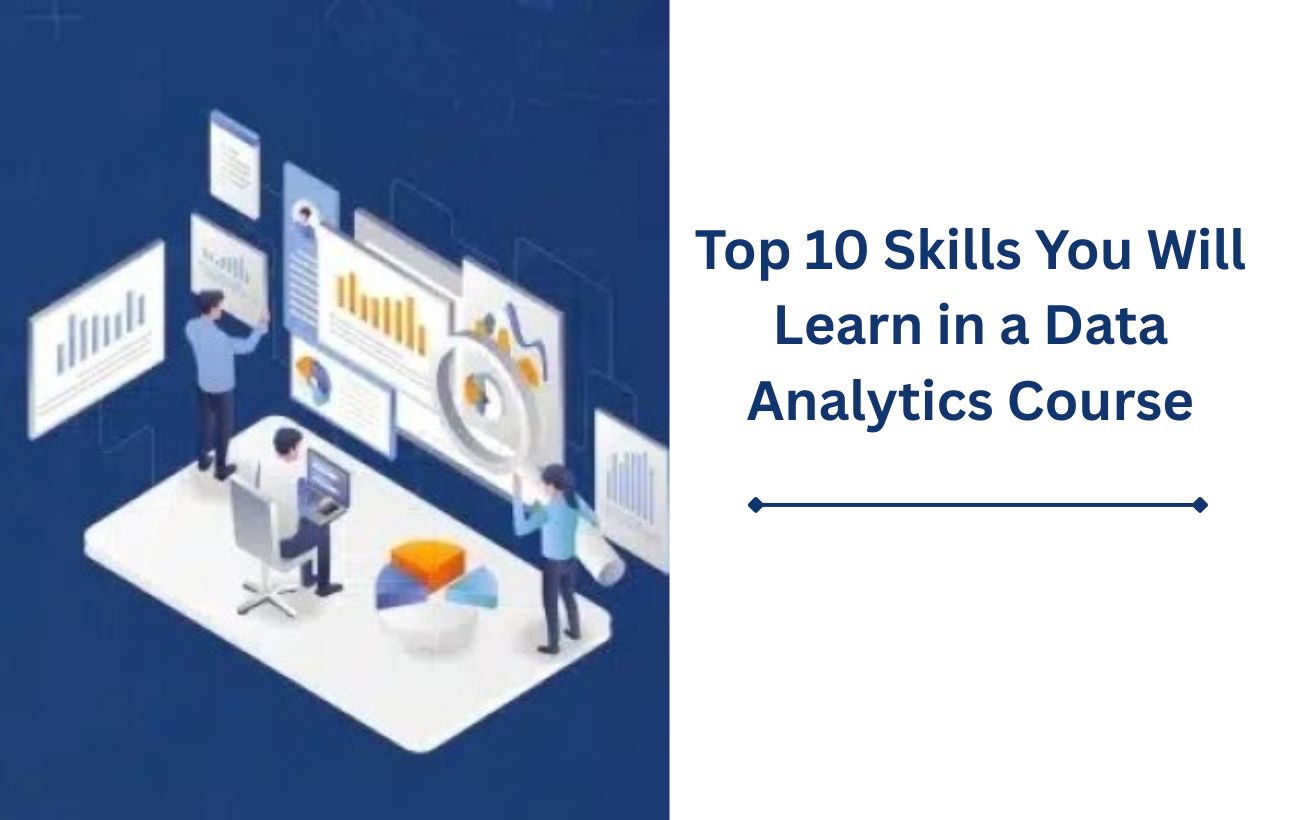
In today’s rapidly evolving job market, data plays a crucial role in nearly every business decision. Whether it’s figuring out which product to introduce or analyzing customer behaviour, companies rely on data at every turn. The growing importance of data analytics has made it one of the most appealing career paths—not just for engineers or IT grads, but also for those coming from arts, commerce, and management fields.
If you hold a degree in B.Tech, M.Tech, BA, MA, BCom, MCom, BBA, BCA, or MCA in India and are looking to kickstart a career in data analytics, you’re in the right spot. At DVAnalytics, we connect with countless learners like you each year, and one of the most common questions we hear is, “What will I actually learn in a data analytics course?”This blog is here to tackle that question.
Below are the top 10 essential skills you’ll acquire from a high-quality data analytics course—and how they can influence your future.
- Mastery OverExcel
Excel may look simple, but it is still one of the most used tool in data analytics. You shall learn how to clean data, use formulas, work with pivot tables, and generate useful charts. For many job roles like data analyst or MIS executive, Excel still remains the initial point.
Why it matters: A large number of businesses and organisations keep track of data in spreadsheets. If you know how to analyze and understand data using Excel, it gives you a beginers advantage!
Practical exercises: Working with sales data, student records, inventory analysis, etc.
- SQL for Databases
SQL stands for Structured Query Language. It is the tool that lets you talk to databases and pull out the exact data you need. Without SQL, it would be near impossible to work with real-
world datasets.
What you’ll learn:
Writing basic queries
Filtering and sorting data
Joining multiple tables
Aggregation using GROUP BY
Why it matters: Almost every company uses relational databases like MySQL, Oracle, or PostgreSQL. SQL aids you to work with massive datasets and answer business questions like “Which product had the highest sales last month?”
Practical exercises: Writing queries for e-commerce or retail sales analysis
- Data Cleaning Techniques
In the industry, before you even begin to analyze data, you will need to clean it. Cleaning means removing errors, handling missing values, and making sure the data makes sense.
Skills covered:
Identifying inconsistencies
Formatting values
Removing duplicates
Standardizing column formats
Why it matters: Clean data leads to better results. Many business problems arise due to poorly managed data. In this training, you shall learn how to prepare raw data for analysis.
Real-life scenario: Preparing survey responses or customer feedback data for reporting
- Data Visualization
Learning the ability to convert raw data into graphs and dashboards is a major part of your job being a data analyst. You need to use software tools like Power BI and Tableau when you try to create visual narratives from numbers.
You’ll learn:
Creating various charts and graphs like bar, line and pie etc
Designing a dashboard for weekly/monthly reports
Using filters and drilldowns for deeper insights
Why it matters: Data is habitually complicated and in such a scene, good visuals help managers and stakeholders understand key trends quickly and make decisions faster.
Hands-on projects: Building dashboards for HR analytics or sales monitoring
- Python Programming (Basic to Intermediate)
Python is a user-friendly programming language that is widely used in data analytics. You don’t need to be a coder, but knowing how to write basic Python scripts will be a huge advantage.
Topics covered:
Writing scripts to obtain clean data
Usage of Python libraries like Pandas and NumPy
Working with CSV and Excel files
Why it matters: Python helps automate tasks and handles large datasets that may pose problems for Excel or SQL. It also opens up a world of more advanced subjects such as machine learning.
Sample projects: Analyzing user ratings for an online course or class attendance trends
- Business Intelligence (BI) Tools
Power BI, Tableau, and Google Data Studio are tools that turn data into interactive dashboards. These tools are used in almost every department, from marketing to operations.
You’ll learn:
Importing data from Excel and SQL
Using performance KPIs
Sharing dashboards with team members
Why it matters: BI tools let you make real-time reports, which are essential for improving efficiency and tracking results in any business.
Practice Project: Monthly revenue dashboard for a retail store chain
- Problem Solving and Logical Thinking
Data analytics isn’t just about software; it’s about cracking real-world problems. Here, you shall get a chance at working on case studies and real business scenarios to further finetune and develop your thinking skills.
What you’ll improve:
Breaking down a business challenge
Finding the right data to analyse
Making recommendations based on data patterns
Why it matters: Employers want candidates who can apply analytical thinking in real situations. This skill is valuable in interviews and at the workplace.
Example problem: “Why a sudden sales decline in western region of a large supermarket brand?”
- Statistics and Basic Mathematics
Don’t be afraid! You won’t be solving long equations. But you will learn the basics of stats like mean, median, standard deviation, and correlation.
Topics covered:
Descriptive statistics
Probability and distributions
Hypothesis testing and confidence intervals
Why it matters: These concepts help you understand data more deeply, especially when comparing two or more datasets.
Use case: Analyzing survey data to determine customer satisfaction
- Report Writing and Data Storytelling
Once you analyze the data, you’ll need to report your findings. You’ll learn how to write effective summaries and create presentations that make an impact.
You’ll practice:
Writing executive summary
Creating slides with visual insights
Presenting insights to a non-technical audience
Why it matters: A great analysis is useless if no one understands it. Good communication skills make you stand out from amongst your peers.
Real-world task: Writing a report for senior management on monthly performance metrics
- Project Management & Team Collaboration
As you must know, most data projects are done in teams. You’ll learn to work on shared tasks, use tools like GitHub, Slack, or Trello, and communicate effectively.
Key skills:
Working on group projects
Agile methodology basics
Managing time and tasks
Why it matters: Collaboration and time management are must-haves in today’s hybrid work culture.
Mini-project: Completing a team case study and presenting the findings
How DVAnalytics Helps You Learn All This
At DVAnalytics, the course material is prepared to cover all these skills step-by-step. Whether you prefer online or offline learning, we’ve created a hands-on program that works for students from any background.
Here’s what you get:
Real-time projects
One-on-one mentoring
Placement assistance
Weekly doubt-clearing sessions
Habit reforming challenges
We’ve helped students from BCom, BA, B.Tech, and BBA backgrounds land jobs at companies like Wells Fargo, Standard Chartered, EXL, JP Morgan, Airtel, Accenture, and Bank of America to name a few.
Our trainers are industry professionals, and our curriculum is updated every quarter based on market trends. You’ll also build a personal portfolio on GitHub to showcase your work.
Final Thoughts
A solid data analytics course goes beyond just teaching you the tools; it helps you gain confidence. It equips you to enter the professional world and tackle real issues with data.
If you’re looking to advance your career in data analytics in Bangalore, join us at DV Analytics and start your journey today. Remember, in data analytics, your skills are your greatest asset. So why not start developing them now?
 SINCE 2010